Monitoring Kubernetes with Security Onion
Introduction
After adding Kubernetes to my homelab, I wanted to learn how to hack and hunt for malicious activity involving containers. I found Kubernetes GOAT which provides a great way to practice hacking. To do the hunting, we need some additional work to enable telemetry on networks, containers, and Kubernetes. In this post I’ll walk through how I instrumented my Microk8s cluster to hunt for the hacking actions you can do in the GOAT.
Note: Kubernetes GOAT (KG from now on) expects kubectl to work. Using Microk8s, I needed to find/replace instances of kubectl in the setup/teardown scripts with microk8s kubectl.
Enable telemetry
Network telemetry
Network telemetry for Security Onion is provided by Zeek. Zeek’s sponsor, Corelight, has a page that details some ways to use Zeek to inspect network traffic in Kubernetes. The sidecar method was attractive to me because it was relevant for work.
A sidecar container is a secondary container that runs alongside the main container in the same Kubernetes pod. It shares the pod’s network and storage resources, allowing it to interact closely with the primary container. Sidecars can be used to enhance the main container’s functionality, such as logging, monitoring, or security. In my case, the sidecar container is used to inspect network traffic for threat hunting without interfering with the main container’s operations.
I added a Zeek sidecar by modifying scenario/<scenario>/deployment.yaml from the KG Github files. This will mount the NFS share, create a directory with the pod’s name, then start sniffing on eth0, outputting in JSON format to the pod name directory. This lets me store the logs on my NAS, saving Kubernetes cluster disk space.
1
2
3
4
5
6
7
8
9
10
11
12
13
14
15
16
17
18
19
20
21
22
23
24
25
26
27
28
29
30
31
32
- name: zeek-sidecar
image: zeek/zeek:latest
args:
- /bin/sh
- -c
- zeek -i eth0 Log::default_logdir=/zeek/logs/$POD_NAME LogAscii::use_json=T
resources:
  requests:
	cpu: "100m"
	memory: "200Mi"
  limits:
	cpu: "200m"
	memory: "500Mi"
volumeMounts:
- name: zeek-logs
  mountPath: /zeek/logs
env:
- name: INTERFACE
  value: "eth0"
- name: POD_NAME
  valueFrom:
	fieldRef:
	  fieldPath: metadata.name
lifecycle:
  postStart:
	exec:
	  command: ["/bin/sh", "-c", "mkdir -p /zeek/logs/$POD_NAME"]
volumes:
- name: zeek-logs
  nfs:
	server: truenas.kimobu.space
	path: /mnt/Data/nfs_storage/kube/zeek/logs
After running the KG set up script, you can see that there are 2(+) containers running in each pod:
1
2
NAME                                               READY   STATUS              RESTARTS   AGE
build-code-deployment-69cccc5769-kn27f             2/2     Running             0          48m
Host telemetry
The defacto standard for collecting container host telemetry off Kubernetes seems to be Sysdig’s Falco and again this is work relevant so I’ll be doing it. Falco install is simple:
1
2
3
helm repo add falcosecurity https://falcosecurity.github.io/charts
helm repo update
helm install falco falcosecurity/falco
Next we need to configure Falco. Output the current config via helm show values falcosecurity/falco > /mnt/nfs/falco/falco-default-values.yaml then edit the resulting file. These changes include:
- Changing the containerd socket to the microk8s location
- Add my NFS mount for the log
- Enable JSON output
- Install and load the k8saudit plugin
- Create a custom rule that will output execve events. Only the modifications are shown.
1
2
3
4
5
6
7
8
9
10
11
12
13
14
15
16
17
18
19
20
21
22
23
24
25
26
27
28
29
30
31
32
33
collectors:
  containerd:
    socket: /var/snap/microk8s/common/run/containerd.sock

mounts:
  volumes:
  - name: falco-logs
    nfs:
      server: truenas.kimobu.space
      path: /mnt/Data/nfs_storage/kube/falco/logs
  volumeMounts:
  - name: falco-logs
    mountPath: /var/log/falco

json_output: true

falcoctl:
  artifact:
  install:
    resolveDeps: true
    refs: [falco-rules, k8saudit-rules, k8saudit, json]
  follow:
    refs: [falco-rules, k8saudit-rules, k8saudit, json]

customRules:
  custom-rules.yaml: |
    - rule: Log Execve Syscalls for Elasticsearch
      desc: Capture execve system calls and log them in a structured format for Elasticsearch ingest pipelines.
      condition: evt.type = execve and container.id != host
      output: >
        "%user.name %user.uid %group.gid %proc.pid %proc.ppid %proc.name %proc.cmdline %proc.exepath %proc.args %proc.cwd %container.id %container.name %container.name %container.image.repository:%container.image.tag %k8s.pod.name %k8s.pod.name %k8s.pod.uid %k8s.pod.uid %k8s.ns.name %k8s.ns.name %k8s.pod.labels %container.privileged %proc.aname[1] %proc.aname[2]"
      priority: Debug
      tags: [system_call, execve, elasticsearch]
I also needed to update microk8s auditing. Create file /var/snap/microk8s/current/args/audit-policy.yaml:
1
2
3
4
apiVersion: audit.k8s.io/v1
kind: Policy
rules:
- level: Metadata
Edit /var/snap/microk8s/current/args/kube-apiserver and append:
1
2
--audit-log-path=/mnt/nfs/falco/logs/audit.log
--audit-policy-file=${SNAP_DATA}/args/audit-policy.yaml
Then systemctl restart snap.microk8s.daemon-kubelite
Ingest the data
First I install Elastic Agent to the Kubernetes control plane.
Agent policy
Create a new agent policy to collect the Kubernetes logs. This policy contains these integrations:
- Custom Logs named k8s-audit which collects
/mnt/nfs/falco/logs/audit.log - Custom Logs named k8s-falco which collects
/mnt/nfs/falco/logs/falco.log - Custom Logs named k8s-zeek-logs which collects
/mnt/nfs/zeek/*/*.log
Falco processor
Create an ingest pipeline processor (falco) for Falco logs. When the Elastic Agent started collecting these logs via the above policy, it automatically created a pipeline logs-falco-2.3.0 so attach the processor to that pipeline. This uses 2 Painless scripts to parse the Falco output into ECS objects. If the log comes from the syscall rule, one script runs and if it doesn’t a different script runs. This handles the different fields that are in each output.
1
2
3
4
5
6
7
8
9
10
11
12
13
14
15
16
17
18
19
20
21
22
23
24
25
26
27
28
29
30
31
32
33
34
35
36
37
38
39
40
41
42
43
44
45
[
  {
    "json": {
      "field": "message",
      "target_field": "json"
    }
  },
  {
    "script": {
      "source": "ctx['network'] = [:];\nctx['network']['transport'] = ctx['json']['output_fields']['fd.l4proto'];\nctx['network']['type'] = ctx['json']['output_fields']['fd.type'];\nctx['process'] = [:];\nctx['process']['name'] = ctx['json']['output_fields']['proc.name'];\nctx['process']['interactive'] = ctx['json']['output_fields']['proc.tty'];\nctx['process']['executable'] = ctx['json']['output_fields']['proc.exepath'];\nctx['process']['command_line'] = ctx['json']['output_fields']['proc.cmdline'];\nctx['user'] = [:];\nctx['user']['id'] = ctx['json']['output_fields']['user.uid'];\nctx['user']['name'] = ctx['json']['output_fields']['user.name'];\nctx['process']['executable'] = ctx['json']['output_fields']['proc.exepath'];\nctx['source'] = [:];\nctx['source']['port'] = ctx['json']['output_fields']['fd.lport'];\nctx['destination'] = [:];\n\nctx['destination']['port'] = ctx['json']['output_fields']['fd.rport'];\nctx['container'] = [:];\nctx['container']['image'] = [:];\nctx['container']['image']['tag'] = ctx['json']['output_fields']['container.image.tag'];\nctx['container']['image']['repository'] = ctx['json']['output_fields']['container.image.repository'];\nctx['container']['name'] = ctx['json']['output_fields']['container.name'];\nctx['container']['id'] = ctx['json']['output_fields']['container.id'];\nctx['orchestrator'] = [:];\nctx['orchestrator']['namespace'] = ctx['json']['output_fields']['k8s.ns.name'];\nctx['orchestrator']['resource'] = ['name' : ctx['json']['output_fields']['container.id']];\nctx['event']['type'] = ctx['json']['output_fields']['evt.type'];\nctx['tags'].addAll(ctx['json']['tags']);\n\nif (ctx['json']['output_fields'].containsKey('fd.name') && ctx['json']['output_fields']['fd.name']!= null) {\n    // Get the 'fd.name' field value\n    String fdName = ctx['json']['output_fields']['fd.name'];\n    \n    // Use regex to capture the source and destination IPs\n    Matcher m = /(\\d{1,3}\\.\\d{1,3}\\.\\d{1,3}\\.\\d{1,3}):\\d+->(\\d{1,3}\\.\\d{1,3}\\.\\d{1,3}\\.\\d{1,3}):\\d+/.matcher(fdName);\n    \n    if (m.find()) {\n        String sourceIP = m.group(1);    // First captured IP (source IP)\n        ctx['source']['ip'] = sourceIP;\n        String destIP = m.group(2);      // Second captured IP (destination IP)\n        ctx['destination']['ip'] = destIP;\n    }\n}",
      "if": "ctx.json.rule != 'Log Execve Syscalls for Elasticsearch'",
      "description": "Process Falco alerts"
    }
  },
  {
    "script": {
      "source": "ctx['process'] = [:];\nctx['process']['name'] = ctx['json']['output_fields']['proc.name'];\nctx['process']['interactive'] = ctx['json']['output_fields']['proc.tty'];\nctx['process']['executable'] = ctx['json']['output_fields']['proc.exepath'];\nctx['process']['command_line'] = ctx['json']['output_fields']['proc.cmdline'];\nctx['process']['args'] = ctx['json']['output_fields']['proc.args'];\nctx['process']['pid'] = ctx['json']['output_fields']['proc.pid'];\nctx['process']['working_directory'] = ctx['json']['output_fields']['proc.cwd'];\nctx['process']['parent'] = [:];\nctx['process']['parent']['pid'] = ctx['json']['output_fields']['proc.ppid'];\nctx['process']['parent']['name'] = ctx['json']['output_fields']['proc.aname[1]'];\nctx['process']['grandparent'] = ['name': ctx['json']['output_fields']['proc.aname[1]']];\nctx['user'] = [:];\nctx['user']['id'] = ctx['json']['output_fields']['user.uid'];\nctx['user']['name'] = ctx['json']['output_fields']['user.name'];\nctx['container'] = [:];\nctx['container']['image'] = [:];\nctx['container']['image']['tag'] = ctx['json']['output_fields']['container.image.tag'];\nctx['container']['image']['repository'] = ctx['json']['output_fields']['container.image.repository'];\nctx['container']['security_context'] = ['privileged' : ctx['json']['output_fields']['container.privileged']];\nctx['container']['name'] = ctx['json']['output_fields']['container.name'];\nctx['container']['id'] = ctx['json']['output_fields']['container.id'];\nctx['orchestrator'] = [:];\nctx['orchestrator']['namespace'] = ctx['json']['output_fields']['k8s.ns.name'];\nctx['orchestrator']['resource'] = ['name' : ctx['json']['output_fields']['k8s.pod.name']];\nctx['orchestrator']['resource']['label'] = ctx['json']['output_fields']['k8s.pod.labels'];\nctx['orchestrator']['resource']['id'] = ctx['json']['output_fields']['k8s.pod.uid'];\nctx['event']['type'] = \"syscall\";\nctx['group'] = ['id' : ctx['json']['output_fields']['group.gid']];\n",
      "if": "ctx.json.rule == 'Log Execve Syscalls for Elasticsearch'",
      "description": "Process Falco syscall"
    }
  },
  {
    "set": {
      "field": "orchestrator.type",
      "value": "kubernetes"
    }
  },
  {
    "set": {
      "field": "event.reason",
      "copy_from": "json.rule"
    }
  },
  {
    "set": {
      "field": "message",
      "copy_from": "json.output"
    }
  },
  {
    "remove": {
      "field": "json"
    }
  }
]
Then apply this to future logs via:
1
2
3
4
5
6
7
8
9
10
11
PUT /_index_template/logs-falco
{
  "index_patterns": ["logs-falco-*"],
  "template": {
    "settings": {
      "index": {
        "default_pipeline": "logs-falco-2.3.0"
      }
    }
  }
}
If you’ve already had an index created from the template, for example because the agent has already sent logs, then also apply this pipeline to the current index, adjust 2024.09.13-000001 to match your index:
1
2
3
4
5
6
PUT /.ds-logs-falco-default-2024.09.13-000001/_settings
{
  "index": {
    "default_pipeline": "logs-falco-2.3.0"
  }
}
Zeek logs
Security Onion already processes Zeek logs (usually from /nsm/zeek) so I hook my k8s-zeek-logs policy into that pipeline. Copy/paste the processors from the zeek-logs policy that is part of the so-grid-nodes-general policy and paste it into the new one, changing the tokenizer path and adding a few Javascript lines to enrich with the pod name. When click-opsing through the policy GUI, it failed to apply the ingest policy since it was managed already. I clicked Preview API Request, added the "force": true option, and sent it via the Console.
1
2
3
4
5
6
7
8
9
10
11
12
13
14
15
16
17
18
19
20
21
22
23
24
25
26
27
28
29
30
31
32
33
34
POST kbn:/api/fleet/package_policies
{
  "policy_id": "0eaf17e0-6e36-11ef-a8bf-2f21315ac90d",
  "package": {
    "name": "log",
    "version": "2.3.0"
  },
  "name": "k8s-zeek-logs",
  "description": "Collect zeek logs from the Kubernetes NFS share",
  "namespace": "so",
  "force": true,
  "inputs": {
    "logs-logfile": {
      "enabled": true,
      "streams": {
        "log.logs": {
          "enabled": true,
          "vars": {
            "paths": [
              "/mnt/nfs/zeek/logs/*/*.log"
            ],
            "exclude_files": [],
            "ignore_older": "72h",
            "data_stream.dataset": "zeek",
            "tags": [],
            "processors": "- dissect:\n    tokenizer: \"/mnt/nfs/zeek/logs/%{pod}/%{pipeline}.log\"\n    field: \"log.file.path\"\n    trim_chars: \".log\"\n    target_prefix: \"\"\n- script:\n      lang: javascript\n      source: >\n        function process(event) {\n          var pl = event.Get(\"pipeline\");\n          var pod = event.Get(\"pod\");\n          event.Put(\"@metadata.pipeline\", \"zeek.\" + pl);\n          event.Put(\"host.name\", pod);  // Add the pod name to ECS host.name\n          event.Put(\"k8s.pod.name\", pod);  // Custom field for pod name\n        }\n- add_fields:\n    target: event\n    fields:\n      category: network\n      module: zeek\n- add_tags:\n    tags: \"kubernetes\"",
            "custom": "exclude_files: [\"analyzer|broker|capture_loss|cluster|conn-summary|console|ecat_arp_info|known_certs|known_hosts|known_services|loaded_scripts|ntp|ocsp|packet_filter|reporter|stats|stderr|stdout.log$\"]"
          }
        }
      }
    }
  }
}
k8s audit
For k8s audit logs, we get a nice JSON field and can set values directly. Like the Falco logs, we can create another ingest pipeline and attach it to the default logs-k8s-2.3.0 that gets created.
1
2
3
4
5
6
7
8
9
10
11
12
13
14
15
16
17
18
19
20
21
22
23
24
25
26
27
28
29
30
31
32
33
34
35
36
37
38
39
40
41
42
43
44
45
46
47
48
49
50
51
52
53
54
55
56
57
58
59
60
61
62
63
64
65
66
67
68
69
70
71
72
73
74
75
76
77
78
79
80
81
82
83
84
85
86
87
88
89
90
91
92
93
94
95
96
97
98
99
100
101
102
103
104
105
106
107
108
109
110
111
112
113
114
115
116
117
118
119
120
121
122
123
124
125
126
127
128
129
130
131
132
133
134
135
136
137
138
139
140
[
  {
    "json": {
      "field": "message",
      "target_field": "ctx"
    }
  },
  {
    "set": {
      "field": "user_agent.original",
      "copy_from": "ctx.userAgent",
      "ignore_failure": true
    }
  },
  {
    "set": {
      "field": "user.id",
      "copy_from": "ctx.user.uid",
      "ignore_failure": true
    }
  },
  {
    "set": {
      "field": "user.name",
      "copy_from": "ctx.user.username",
      "ignore_failure": true
    }
  },
  {
    "set": {
      "field": "group.name",
      "ignore_failure": true,
      "copy_from": "user.groups"
    }
  },
  {
    "set": {
      "field": "orchestrator.type",
      "value": "kubernetes",
      "ignore_failure": true
    }
  },
  {
    "set": {
      "field": "orchestrator.namespace",
      "copy_from": "ctx.objectRef.namespace",
      "ignore_failure": true
    }
  },
  {
    "set": {
      "field": "orchestrator.api_version",
      "copy_from": "ctx.objectRef.apiVersion",
      "ignore_failure": true
    }
  },
  {
    "set": {
      "field": "orchestrator.resource.type",
      "copy_from": "ctx.objectRef.resource",
      "ignore_failure": true
    }
  },
  {
    "set": {
      "field": "orchestrator.resource.annotation",
      "copy_from": "ctx.annotations",
      "ignore_failure": true
    }
  },
  {
    "set": {
      "field": "orchestrator.resource.name",
      "ignore_failure": true,
      "copy_from": "ctx.objectRef.name"
    }
  },
  {
    "set": {
      "field": "event.action",
      "copy_from": "ctx.verb",
      "ignore_failure": true
    }
  },
  {
    "set": {
      "field": "event.code",
      "copy_from": "ctx.responseStatus.code",
      "ignore_failure": true
    }
  },
  {
    "set": {
      "field": "event.stage",
      "ignore_failure": true,
      "copy_from": "stage"
    }
  },
  {
    "set": {
      "field": "source.ip",
      "copy_from": "ctx.sourceIPs",
      "ignore_failure": true
    }
  },
  {
    "script": {
      "source": "String pod_name = ctx['ctx']['user']['extra']['authentication.kubernetes.io/pod-name'][0];\nctx['orchestrator']['resource']['name'] = pod_name;",
      "ignore_failure": true
    }
  },
  {
    "script": {
      "source": "String pod_id = ctx['ctx']['user']['extra']['authentication.kubernetes.io/pod-uid'][0];\nctx['orchestrator']['resource']['id'] = pod_id;",
      "ignore_failure": true
    }
  },
  {
    "script": {
      "source": "String decision = ctx['ctx']['annotations']['authorization.k8s.io/decision'];\nctx['event']['outcome'] = decision;",
      "ignore_failure": true
    }
  },
  {
    "script": {
      "source": "String reason = ctx['ctx']['annotations']['authorization.k8s.io/reason'];\nctx['event']['reason'] = reason;",
      "ignore_failure": true
    }
  },
  {
    "remove": {
      "field": "ctx"
    }
  },
  {
    "remove": {
      "field": "message"
    }
  }
]
Again, like with Falco, set the default pipeline on the index template and the current index.
Result
For Zeek, we can build a netflow view and see a pod name where applicable: 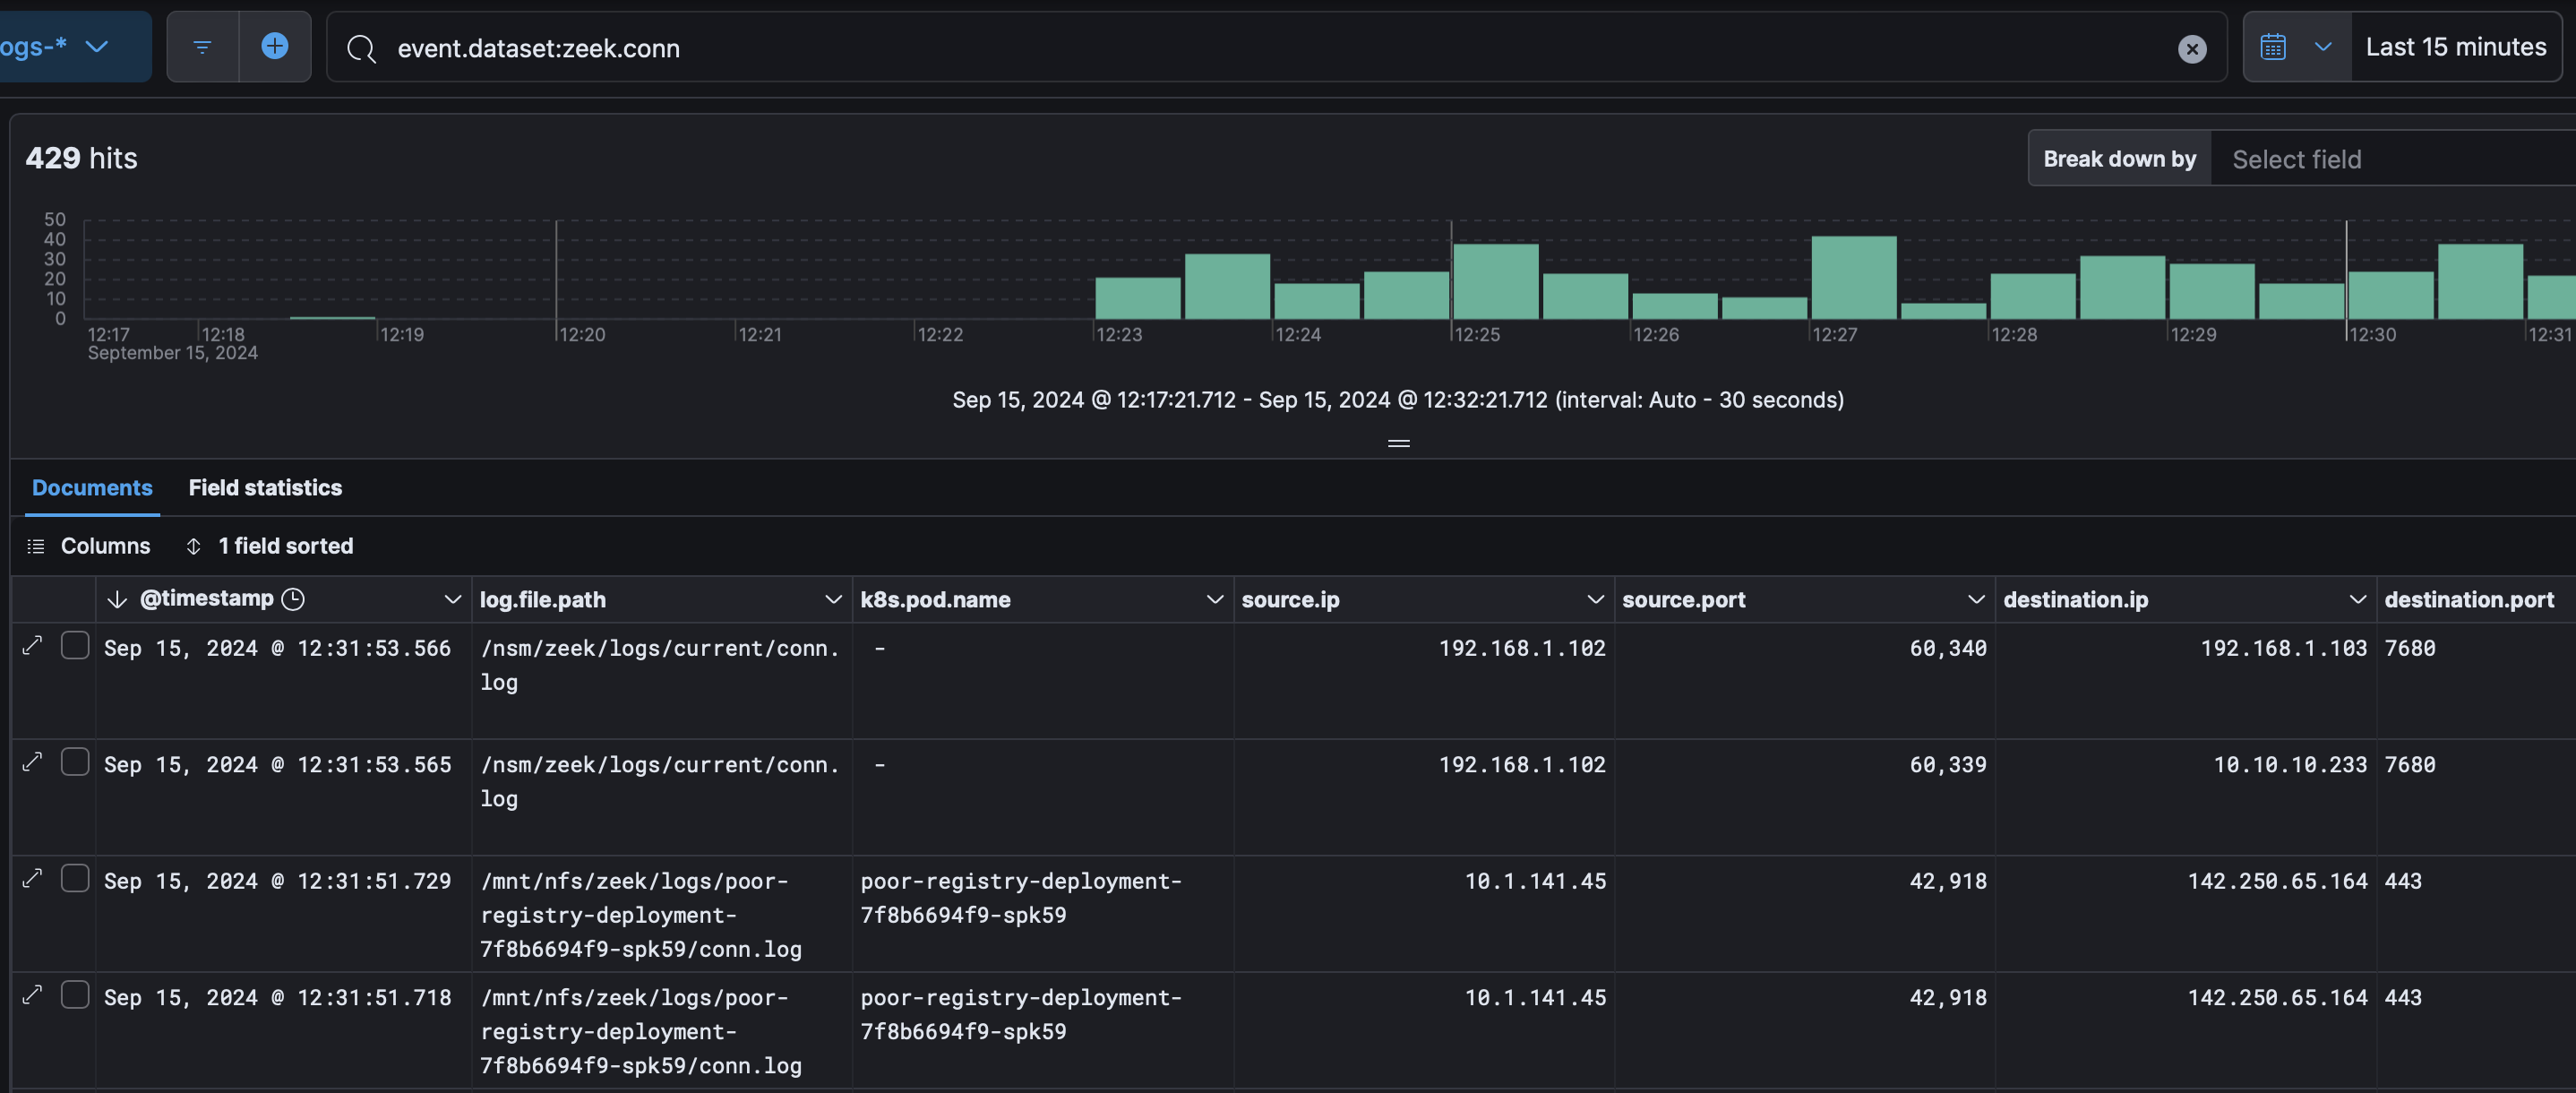 For Falco we can see both alerts and syscall activity:
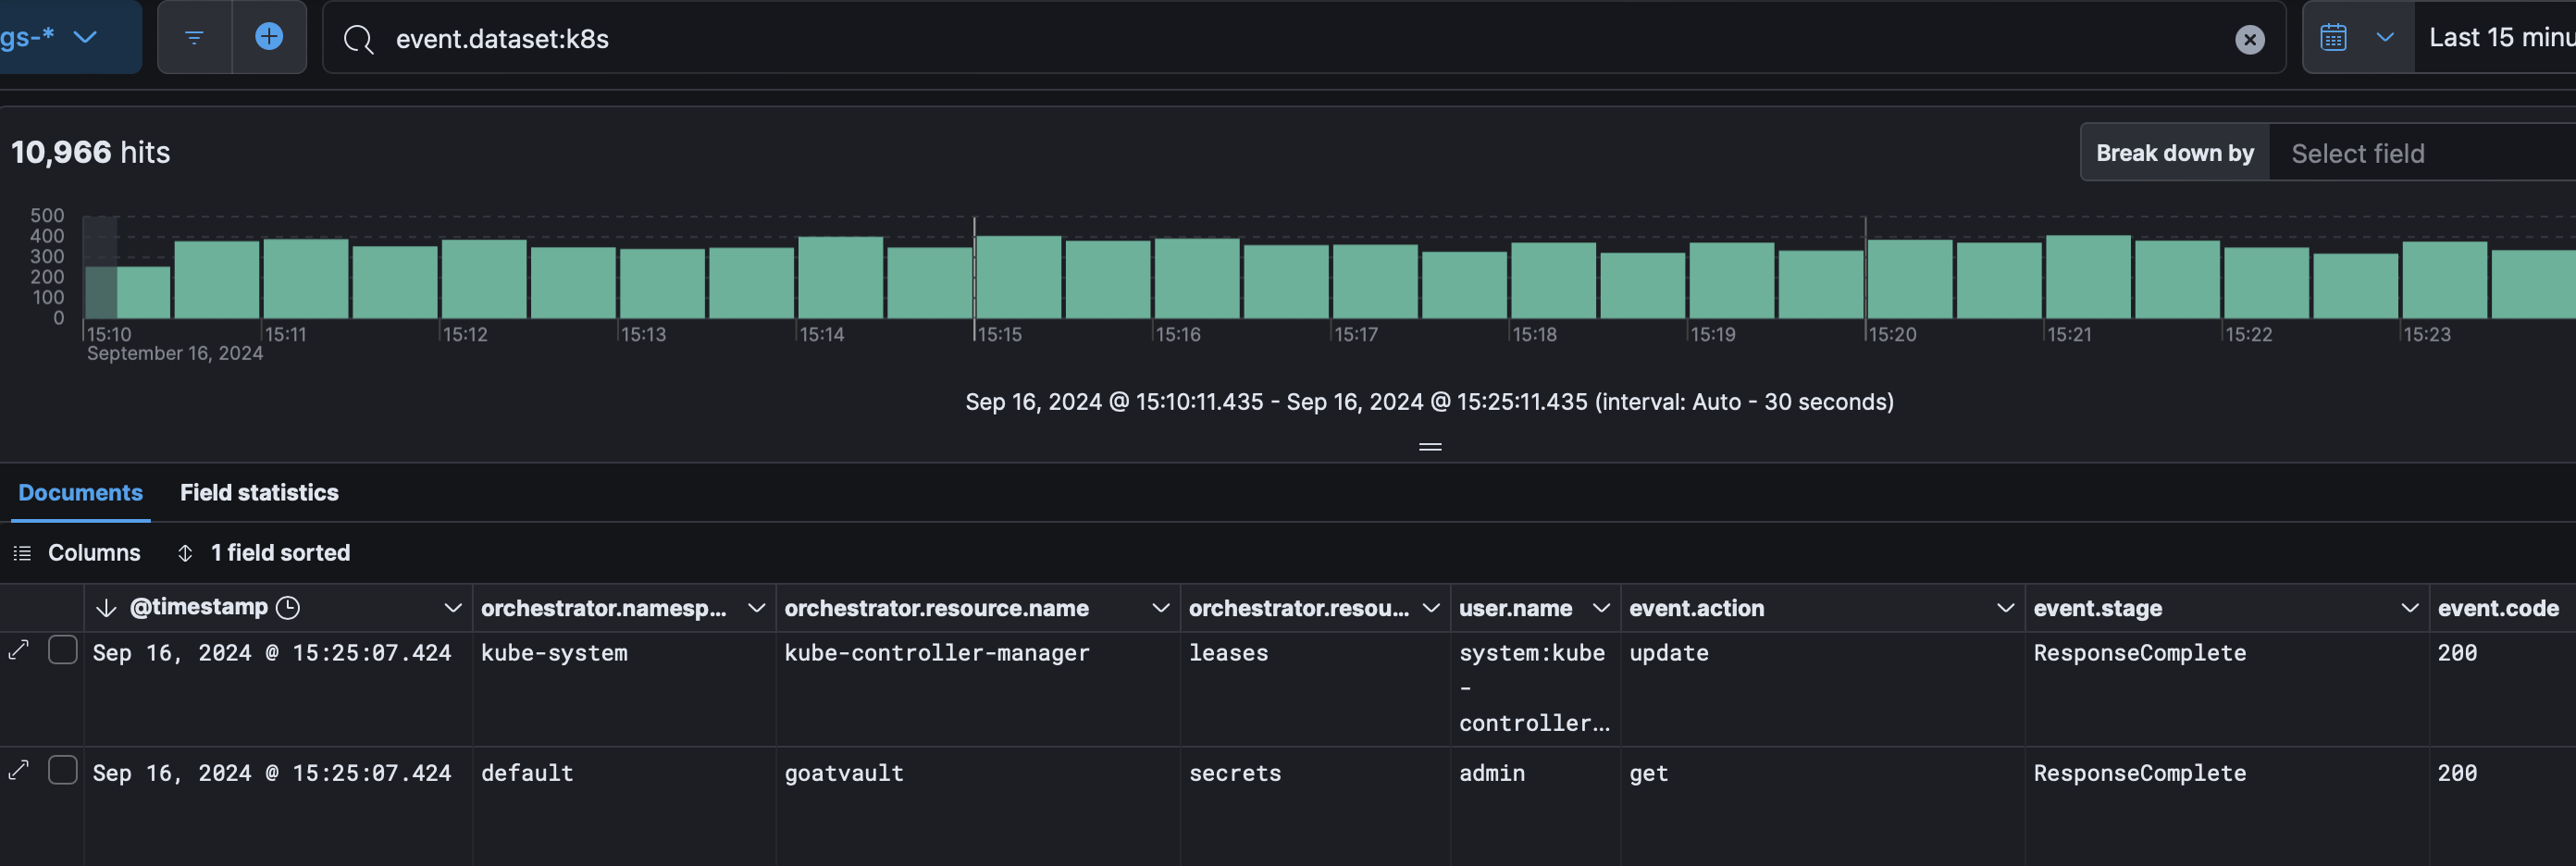
 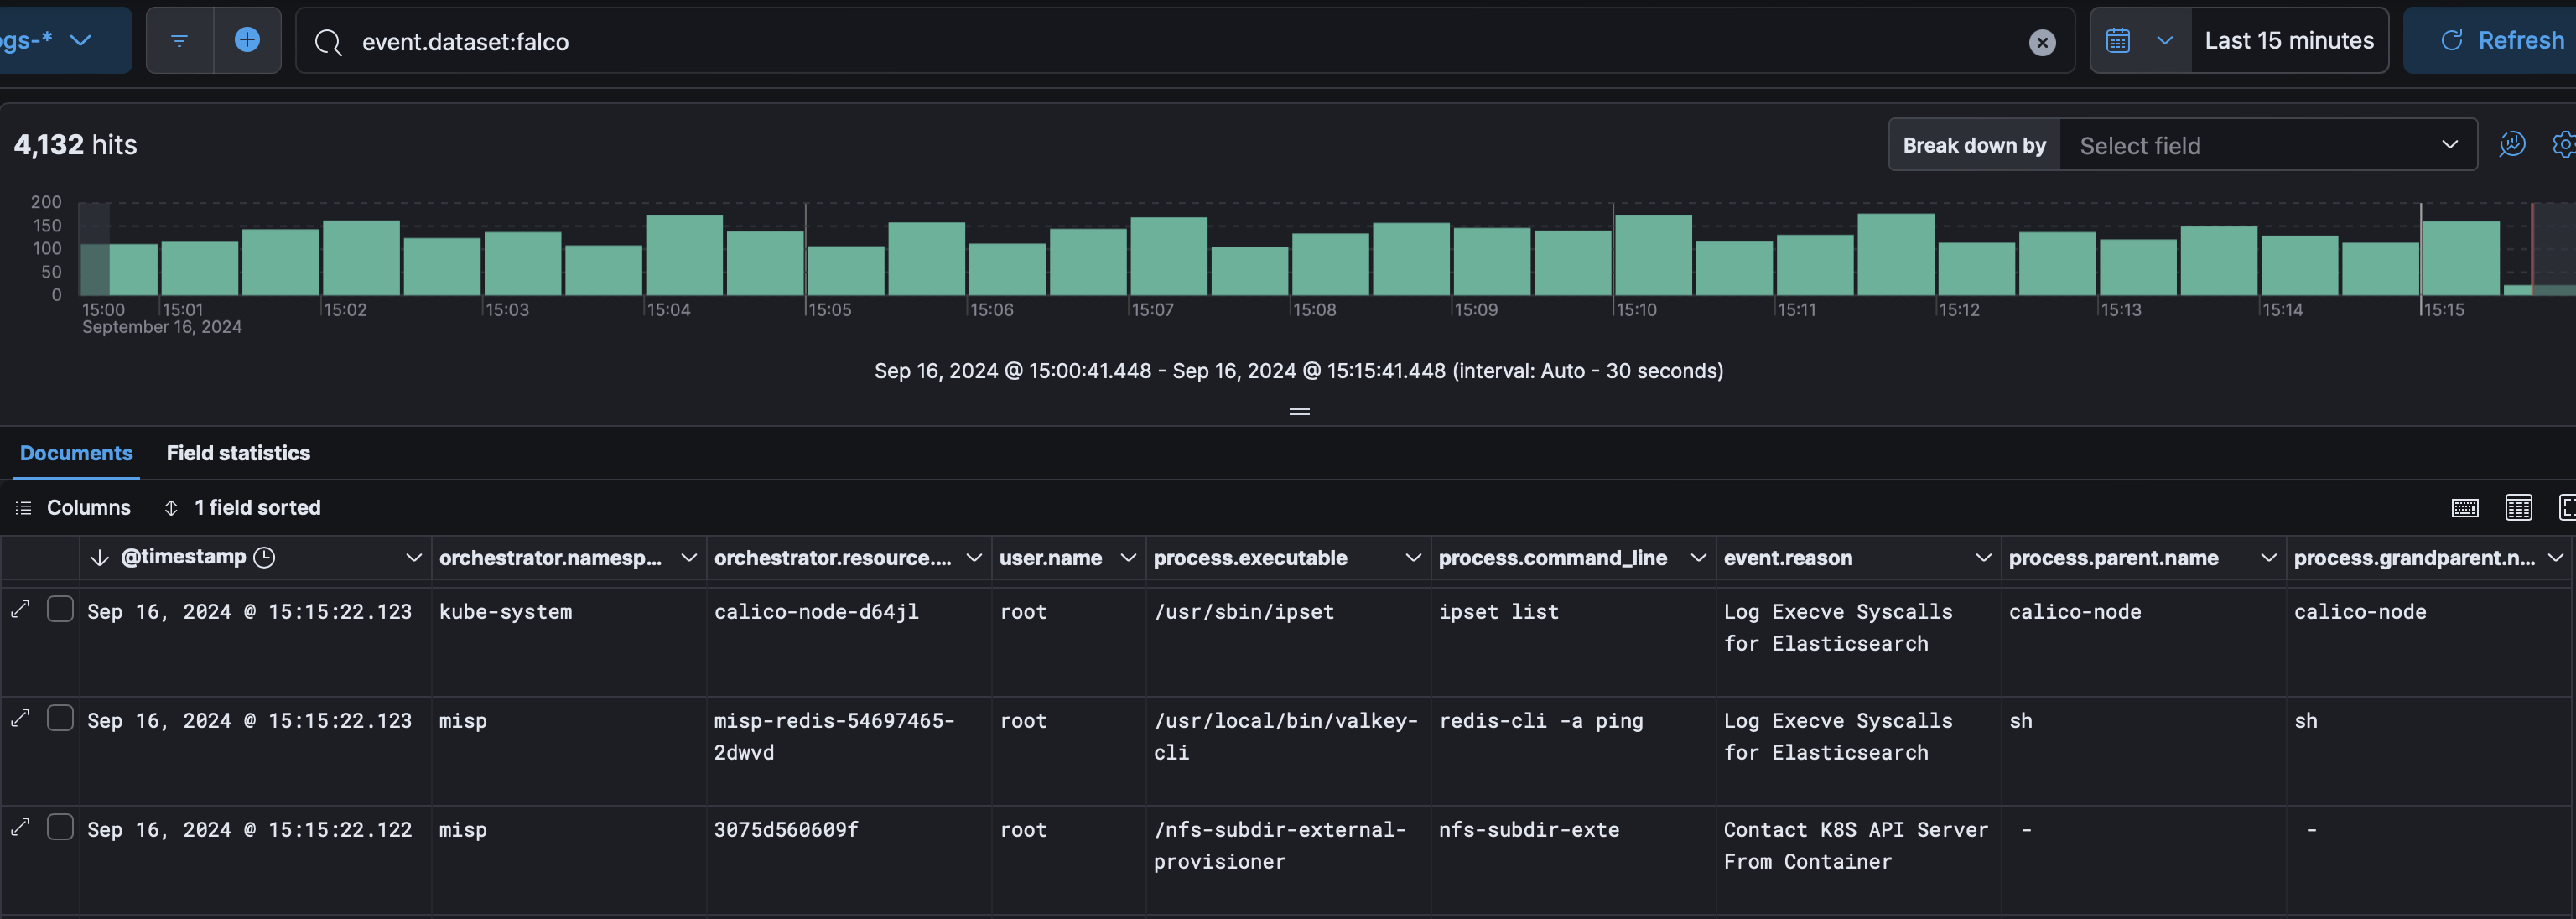 For k8saudit we can see who did what on what resource: